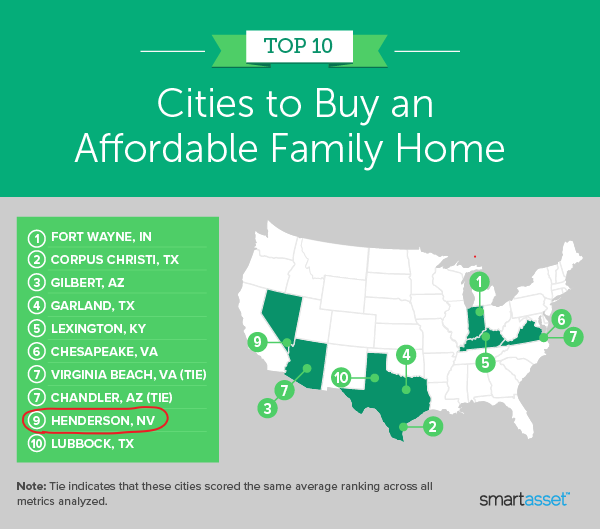
Best Cities in the US to Buy an Affordable Family Home – New Report has Henderson at #9 and North Las Vegas at #20
Stephanie Horan, CEPF® With higher housing costs and smaller living spaces, many large cities are less conducive to families. According to Census Bureau data, average monthly housing costs for homeowners across the 100 largest U.S. cities are more than 23% higher than the national average.
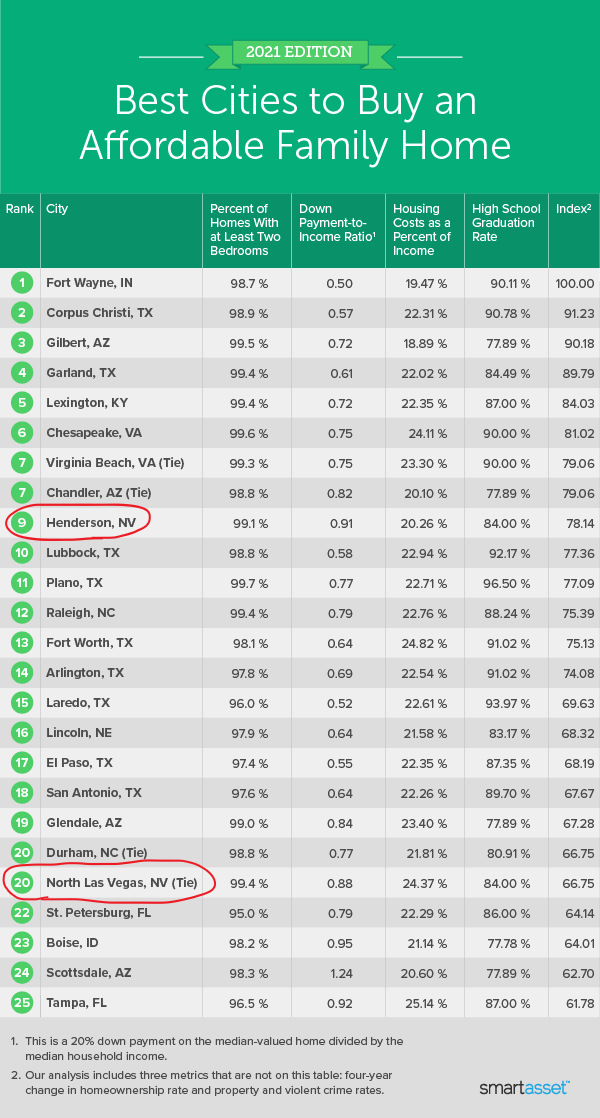
Some large cities buck the trend, however. In this study, SmartAsset looked at data on 100 of the largest U.S. cities to identify the best cities to buy an affordable family home. We considered seven metrics: the percentage of homes with at least two bedrooms, the four-year change in homeownership rate, two affordability measures (down payment-to-income ratio and housing costs as a percentage of income) and three livability statistics (high school graduation rate along with property and violent crime rates). For details on our data sources and how we put all the information together to create our final rankings, check out the Data and Methodology section below.
This is SmartAsset’s second annual study on the best cities to buy an affordable family home.
Data and Methodology
To find the best cities to buy an affordable family home, SmartAsset looked at data for 100 of the largest cities in the U.S. We compared cities across seven metrics:
Percentage of homes with at least two bedrooms. This is the number of owner-occupied homes with at least two bedrooms divided by all owner-occupied homes. Data comes from the Census Bureau’s 2019 1-year American Community Survey.
Four-year change in homeownership rate. This is the difference between the 2015 and 2019 homeownership rates. Data comes from the Census Bureau’s 2015 and 2019 1-year American Community Surveys.
Down payment-to-income ratio. This is a 20% down payment on the median-valued home divided by the median household income. Data comes from the Census Bureau’s 2019 1-year American Community Survey.
Housing costs as a percentage of income. This is median annual housing costs for owner-occupied housing units divided by the median household income. Data comes from the Census Bureau’s 2019 1-year American Community Survey.
High school graduation rate. Data comes from the 2021 County Health Rankings.
Property crime rate. This is the number of property crimes per 100,000 residents. Data comes from the FBI Uniform Crime Reporting Program and is for 2019. We used data from Neighborhood Scout for cities where FBI data was not available.
Violent crime rate. This is the number of violent crimes per 100,000 residents. Data comes from the FBI Uniform Crime Reporting Program and is for 2019. We used data from Neighborhood Scout for cities where FBI data was not available.
We ranked each city in every metric, giving a half weighting to property and violent crime rates and a full weighting to all other metrics. We then found each city’s average ranking and used the average to determine a final score. The city with the highest average ranking received a score of 100. The city with the lowest average ranking received a score of 0.
Home Buying Tips
Be realistic. Make sure you know how much house you can afford before you even start looking at homes so you don’t fall in love with a unit that is above your price range.
Consider a financial advisor. Buying a home is a big decision and it may be a good idea to consult a financial advisor to better understand your financial situation and what kind of house you can afford. SmartAsset’s free tool matches you with financial advisors in five minutes. If you’re ready to be matched with advisors that will help you achieve your financial goals, get started now.
Questions about our study? Contact us at press@smartasset.com.
Photo credit: ©iStock.com/Dean Mitchell
source - https://smartasset.com/data-studies/best-cities-to-buy-an-affordable-family-home-2021